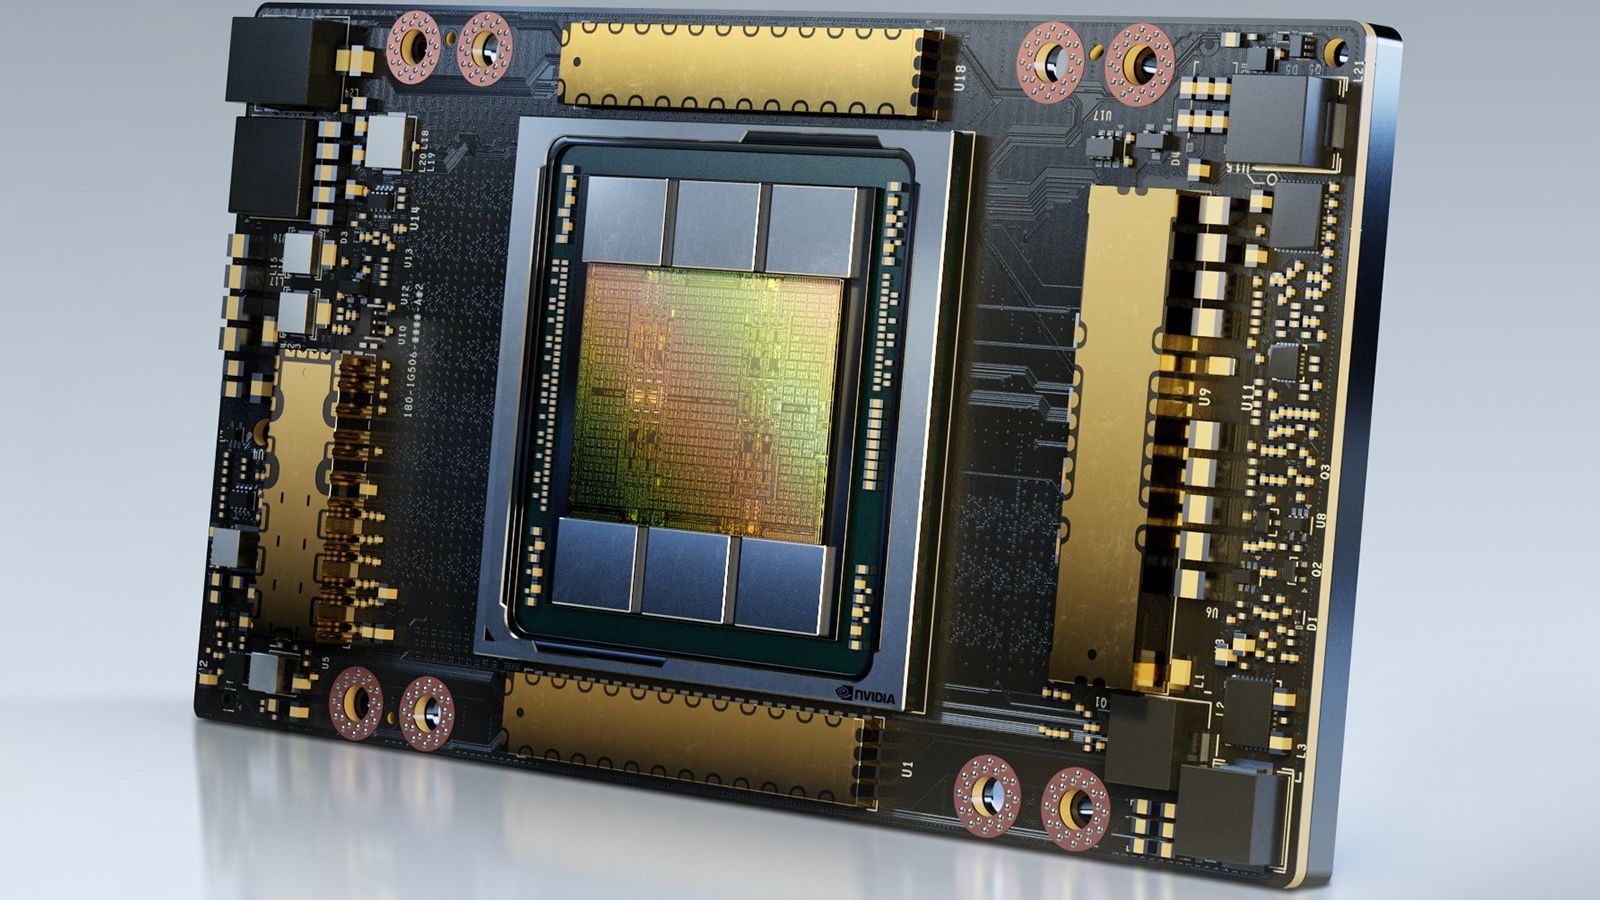
The NVIDIA GPU rental market has become one of the clearest windows into the health of the broader AI boom. This piece pulls together a full-stack view: how much it actually costs to rent an H100, H200, A100, B200 or GB200 today; how rental contracts and depreciation schedules are structured; whether the industry’s chronic supply shortage will ease by 2027-2028; and how that all flows through to the earnings of NVIDIA itself, the neocloud rental operators, the big hyperscalers, and even SpaceX.
1. GPU Rental Pricing by Model (as of August 2026)
Rental rates vary enormously depending on the type of provider. Hyperscalers (AWS, Azure, Google Cloud, Oracle Cloud) charge a premium for enterprise SLAs and InfiniBand-class networking, while neoclouds (CoreWeave, Lambda, RunPod) and marketplaces (Vast.ai) undercut them by 2-5x for the same silicon.
| GPU | Hyperscaler (large) | Neocloud (mid-size) | Marketplace (low end) |
|---|---|---|---|
| A100 80GB | ~$2-3/hr (AWS/GCP) | Crusoe $2.00, Nebius $2.00 | Vast.ai $0.52-0.60 (low), range $1.09-5.07 |
| H100 | AWS P5 ~$6.9-7.5, Azure ND H100 v5 ~$12.3, GCP A3 ~$10-11, OCI $10.75 | CoreWeave $6.16, Lambda $2.49, RunPod $1.99-2.89 | Range $1.49-12.29 (median ~$3-4) |
| H200 | Azure ~$13.78 (highest), OCI ~$10-12 | Jarvislabs $3.99 (spot $1.99), median $4.11 | FluidStack $2.30 (lowest) |
| B200 | Broadly $8-10 | Nebius $7.15, Lambda $6.99, RunPod $8.64+ | Spot from $2.12; 36-month reserved $2.25 (23-provider average) |
| GB200 NVL72 (per GPU) | Available on CoreWeave, Oracle, Azure, GCP | Average $18.23 | Low $10.50, high $27.04 |
Chart 1. GPU Rental Price Range by Model (USD/GPU-hour, low–high, Aug 2026)
Source: Compiled by the author from IntuitionLabs, Spheron, GMI Cloud, Thunder Compute and getdeploying.com market data (Aug 2026).
2. Rental Terms and Contract Structures
CoreWeave offers on-demand plus 6-month, 1-year and 3-year reserved terms, with discounts of 25-60% off on-demand (deepest on 3-year H100/H200 commitments). Example: a 1-year reserved 20-unit L40S cluster runs roughly $10,000-14,000/month.
Lambda does not publish standard reserved pricing; large customers negotiate directly with sales. B200 36-month reserved pricing has fallen to roughly $2.25/GPU-hour across 23 providers — about a 70% discount to on-demand.
Spot/preemptible instances on hyperscalers run 60-91% cheaper than on-demand but with limited availability. Marketplaces like Vast.ai operate on pure hourly billing with no long-term commitment as the default.
3. The Depreciation Debate: 6-Year Book Life vs. Real Economic Life
Microsoft, Google, Meta and Oracle all extended server useful-life assumptions from 3-4 years to 6 years between 2023 and 2024, saving an estimated $18 billion in annual depreciation expense industry-wide, affecting roughly $467 billion of net PP&E. In 2025 the trend began to diverge: Amazon shortened useful life for a subset of servers while Meta extended further.
Among rental operators, CoreWeave depreciates GPUs straight-line over six years (raised from five years in early 2023); Nebius uses four years, closer to NVIDIA’s roughly 3-year architecture cadence.
4. Case Study: What the A100 2029 Re-Contract Really Means
A widely circulated claim suggested H100 GPUs were contracted through 2029. Fact-checking traces this to CoreWeave CEO Mike Intrator’s August 2026 Q2 earnings comments: the GPUs contracted through 2029 at “full freight” pricing are A100s — launched in 2020 — not H100s. That is nine years of full-rate monetization on 2020-vintage silicon.
Separately, expiring H100 contracts are reportedly being immediately re-signed at about 95% of the original rate rather than being liquidated, evidence of continued strong demand for Hopper-generation chips. A Cisco lifecycle document also lists October 19, 2029 as the official H100 end-of-life/support date — likely the source of the “H100 to 2029” conflation, since that is a support cutoff, not a rental contract term.
Short-seller research (Kerrisdale Capital, September 2025) argues the “prime” economic window for AI hardware — peak utilization and peak pricing — is really 3-5 years, compressing toward 1 year in some cases, versus NVIDIA’s roughly 18-24 month architecture cadence (Hopper to Blackwell to Rubin, the latter arriving H2 2026). Under CoreWeave’s own 6-year depreciation and 87% utilization assumptions, Kerrisdale models roughly 20.5% EBIT margin on GB200 economics — but that collapses toward zero or negative under a more realistic 4-5 year life.
Putting together a realistic estimate of GPU economic life requires separating three layers: (1) the technological cutting-edge window, about 2-3 years, matching NVIDIA’s architecture cadence; (2) the “prime” economic window of peak pricing and utilization, roughly 3-5 years; and (3) an observed “tail” period of discounted but still-monetized capacity (mostly inference workloads), which the A100 case stretches to 9 years. Netting these together, a realistic average economic life is closer to 5-7 years — broadly in line with, but not strongly exceeding, current book depreciation schedules. Whether this holds depends heavily on whether today’s extreme GPU scarcity (which is propping up demand for legacy chips) persists once supply normalizes.
5. Will GPU Supply Normalize by 2027-2028? Supply Forecasts vs. Major Analyst Demand Forecasts
The bottleneck keeps shifting down the stack — from logic chips, to advanced packaging, to memory, to electricity — and each layer has a different normalization timeline.
On packaging, TrendForce sees the TSMC CoWoS supply-demand gap narrowing from 20% to 10% by end-2026, with further improvement in 2027 (TSMC is targeting roughly a 4x CoWoS capacity increase by 2027). But Aletheia takes the opposite view: despite that capacity growth, the gap could widen to over 30% in 2027 because NVIDIA alone has pre-booked more than half of the 2026-2027 expansion, keeping lead times at 52-78 weeks. Next-generation CoPoS packaging won’t reach mass production until 2028-2029.
On memory, Samsung and SK Hynix have explicitly warned that severe HBM shortages will persist through 2027 “and beyond” — SK Hynix’s CEO has said demand could exceed capacity even past 2030. All 2027 memory production across Samsung, SK Hynix and Micron is already sold out.
On power — an increasingly binding constraint that chip and packaging capacity alone cannot fix — Goldman Sachs projects US data center power demand rising from 31GW (2025) to 41GW (2026) to 66GW (2027), while Morgan Stanley projects a cumulative power supply gap exceeding 49GW by 2028. Grid, gas-turbine and nuclear buildouts have longer lead times than semiconductor fabs.
Meanwhile, demand forecasts from major institutions keep being revised upward, not down. Goldman Sachs forecasts $1.01 trillion in AI capex for 2027 (+32% YoY from 2026’s $765 billion) and $7.6 trillion cumulative from 2026-2031. McKinsey projects AI-driven data center demand growing from 44GW (2025) to 156GW (2030), requiring roughly $5.2 trillion in capex — and estimates a supply deficit exceeding 15GW in the US alone by 2030 even if every currently announced project is delivered on time.
Chart 2. NVIDIA Data Center Revenue Trend (USD Billion)
FY2027E driven by Blackwell (~$137B) and Rubin ramp (~$38B). Source: Compiled by the author from NVIDIA earnings disclosures and consensus estimates (Yahoo Finance, Futurum Group).
A minority contrarian view exists: Wolfe Research’s Chris Caso argues semiconductor oversupply is “nearly impossible before 2028” given TSMC is fully booked and new fabs are years away — implying 2028 as the earliest plausible point where supply could catch demand for cutting-edge silicon. Separately, some commentary flags 2028-2029 as a risk window for an AI-spending bubble unwinding — but that is a demand-side sustainability risk (can committed capex, like OpenAI’s estimated $600-665 billion of compute commitments through 2030, be matched by revenue?), a different mechanism from a supply-side glut.
Bottom line: full supply normalization by 2027-2028 looks like the optimistic minority case, not the consensus. Logic-chip packaging may partially ease, but memory suppliers themselves are guiding for shortages persisting past 2027, and power — the newest and hardest constraint — has even longer lead times. However, the shortage is concentrated in cutting-edge silicon; legacy GPUs are behaving differently (see next section).
6. Does Frontier Scarcity Keep Legacy GPU Demand Robust? A More Nuanced Answer
There is a real, named phenomenon — “demand spillover” — where companies unable to secure Blackwell/Rubin allocation shift workloads to H100/A100, especially for inference and MoE models. The CoreWeave A100-through-2029 deal is a textbook example, and some data shows H100 rates stabilizing rather than crashing after the Blackwell launch.
But there is a countervailing, less obvious effect: the same frontier scarcity that pushes demand toward legacy GPUs also pushes supply of legacy GPU capacity higher. More than 300 new neocloud operators entered the market in 2025 — most of them unable to secure Blackwell allocation, so they built out capacity on H100/A100 instead, competing for the same legacy-GPU demand they were meant to absorb. The result is highly volatile, bifurcated pricing: H100 on-demand rates fell from $8-10/hr in early 2024 to roughly $1.80-3.50/hr by Q2 2026 (a 64-75% decline) even as utilization/demand data suggested continued strength, before rebounding about 40% (from $1.70 to $2.35/hr on 1-year contracts) between October 2025 and March 2026.
The honest conclusion: utilization of legacy GPUs is likely to stay strong (assets are unlikely to sit idle), which supports the demand-spillover thesis. But rental price/margin is a separate question, and it is under two-way pressure — firm in the reserved/enterprise segment (where power and networking are already sunk, as with CoreWeave’s A100s), but softer in the on-demand/spot/marketplace segment where new entrant supply is growing faster than spillover demand.
7. NVIDIA: Revenue and Profit Outlook by Product
| FY2026 (actual) | FY2027 (forecast) | FY2028 (forecast) | |
|---|---|---|---|
| Data Center revenue | $193.7B (+68% YoY) | Consensus $343-364B (+88% YoY) | Could approach ~$450B if 40% data-center capex growth holds |
| Blackwell | ~$86.4B | ~$137B; default choice for new large-scale buildouts (5.2M Blackwell GPUs shipped in 2025) | Continues to expand, ceding share to Rubin |
| Rubin | Minimal | First shipments H2 2026; consensus ~$38.2B contribution | Scales further, accelerating the shift away from Hopper |
| Hopper (H100/H200) | Mature, declining share | ASP pressure as used H100s enter the secondary market | Further decline |
| Data Center gross margin | ~78% | ~76.3% | – |
| Total company revenue / EPS | – | Consensus $391.3B / EPS $9.34 | – |
| Net income growth | – | +52% YoY forecast | – |
Management has guided to $1 trillion in cumulative Blackwell + Rubin revenue from calendar 2025 through 2027.
8. Neocloud Rental Operators: Revenue and Profit Outlook
| Company | 2025 revenue | 2026 forecast | 2027 forecast | Profitability |
|---|---|---|---|---|
| CoreWeave | $5.1B | Guidance $12.4-13.2B (consensus +147% YoY) | ~$25-30B annualized (consensus +97% YoY) | 2026 adjusted operating income $960M-$1.15B (~8-9% margin); still GAAP net loss. A 15% margin at $25B 2027 revenue would imply ~$4B profit (optimistic case). Stifel projects net debt rising from under $8B to over $30B by 2027. |
| Nebius | – | Guidance $3.0-3.4B; 40% adjusted EBITDA margin; Q2 2026 revenue $582M (record), adjusted EBITDA $236M (turned positive) | Consensus $7.8-10B (+206% YoY); adjusted EBITDA above $5B | Lower leverage than CoreWeave, faster margin improvement |
| Lambda | $520M (+22% YoY) | Pursuing IPO in H2 2026 (unpriced, unscheduled as of writing) | – | ~50% gross margin (61% ex non-cloud); H1 net loss ~$24M; TTM loss ~$175M; $5.9B valuation |
9. Big Clouds and SpaceX
| Company | Recent results | 2027 outlook | Margin |
|---|---|---|---|
| AWS (Amazon) | $37.6B quarterly, +37% YoY | Management says 2027 demand looks even stronger than 2026’s undersupply | ~35-37.7% operating margin |
| Azure (Microsoft) | Intelligent Cloud $34.7B | FY2027 Azure ~$148.9B (+40% vs FY2026’s ~$106B) | ~47% operating margin (highest of the three) |
| Google Cloud | $24.8B quarterly, +82% YoY (fastest growth) | Fastest-growing of the big three | 32.9% operating margin, up sharply from 17.8% |
| Oracle Cloud (OCI) | $5.8B quarterly, +93% YoY | Guided path: ~$32B, then $73B, $114B, $144B across successive years | RPO backlog $553B, heavily concentrated in a single reported OpenAI contract (~$300B+) |
Chart 3. Revenue Growth Rate Comparison (YoY %, 2026-2027 basis)
Bar length scaled to 150% max. Growth rates are representative YoY figures per company guidance/consensus (2026-2027 basis); definitions vary slightly by company. Source: Compiled by the author from company disclosures, Goldman Sachs, and analyst estimates.
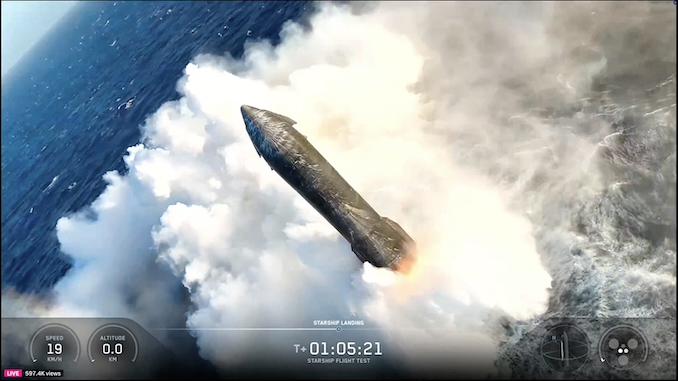
SpaceX has become an unexpected new entrant in AI compute. Following its February 2026 acquisition of xAI, SpaceX now operates the Colossus supercomputer (roughly 550,000 GPUs, ~2GW of power) and has signed AI compute deals with Anthropic and Alphabet worth a combined $2.15 billion per month. Total SpaceX revenue roughly doubled year over year in Q2 2026 (from $4B to $7.8B), with the AI segment now about 17% of revenue.
But forecasts for SpaceX’s AI business diverge enormously: Goldman Sachs projects $34.5 billion by 2027, while SemiAnalysis projects a $305 billion annualized run rate by end-2027 (including $235B from AI compute), and Elon Musk himself has floated $300-500 billion by 2028. This roughly 10x spread between the most conservative and most bullish forecasts makes SpaceX the highest-uncertainty entrant in this comparison, with a large share of its reported ~$1.93 trillion valuation already pricing in AI-business optimism.
Conclusion
Layering all of this together, a consistent hierarchy emerges. NVIDIA, as the equipment seller, captures the highest and most stable margins (mid-to-high 70s% gross margin, +52% net income growth) regardless of which GPU generation wins. The big hyperscalers (AWS, Azure, Google Cloud) sit next, with a profitable core cloud business cushioning AI capex risk and operating margins of roughly 33-47%.
Oracle and SpaceX represent higher-growth, higher-uncertainty bets with concentrated backlogs or wildly divergent forecasts. Pure-play neocloud rental operators sit at the bottom of the margin hierarchy — fast revenue growth, but thin-to-negative operating margins and rising leverage — making them the segment most exposed to the depreciation, contract-duration and legacy-GPU pricing risks discussed above.
In short: robust AI demand does not translate evenly into robust profit across the stack — the equipment maker and the diversified hyperscalers capture most of the margin, while the specialized rental layer bears most of the capital and pricing risk.
This article is a research summary compiled from publicly available analyst reports, company disclosures and news coverage as of August 16, 2026, and does not constitute investment advice.
References
1. CoreWeave Proves Nvidia’s Aging AI GPUs From 2020 Can Generate Profit (Tom’s Hardware)
2. CoreWeave (Kerrisdale Capital research report, PDF)
3. TSMC CoWoS Supply-Demand Gap Narrowing (TrendForce)
5. Tracking Trillions: The Assumptions Shaping the Scale of the AI Build-Out (Goldman Sachs)
6. The Cost of Compute: A $7 Trillion Race to Scale Data Centers (McKinsey)
7. Nvidia’s AI Dominance: Data Center Revenue Poised for 165% Surge by 2027 (Yahoo Finance)
8. Beyond Rockets and Satellites, SpaceX Is Quietly Building an AI Compute Business (Fortune)